Airbnb API for Revenue Calculators: The Data Behind Them
Airbnb revenue calculators are a formula over comp data. Here's how they work, how accurate they are, and how to build your own on a live Airbnb API.
Every Airbnb revenue calculator gives you a confident number. Few of them show you where it came from. It came from a formula and a comp set, and the data feeding both is what decides whether the number is right.
An Airbnb revenue calculator estimates what a listing earns by reading similar listings’ prices and availability, then projecting annual revenue. This post opens the box: the formula, the accuracy levers, the main tools, and how to build your own on a live Airbnb API.
How does an Airbnb revenue calculator work?
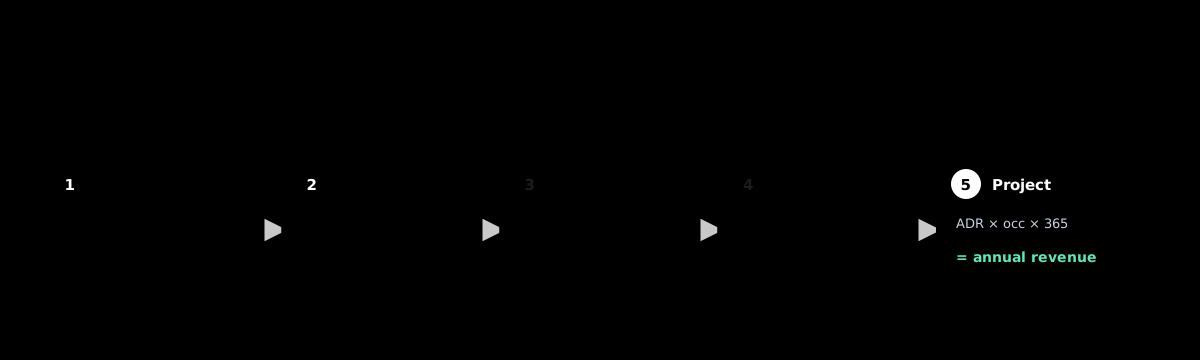
A revenue calculator is a model over a comp set. It finds listings similar to yours by bedrooms, type, and location, reads each one’s nightly price and availability, estimates occupancy from how the calendars fill, then multiplies a representative rate by booked nights to project revenue. The steps are simple. The accuracy lives entirely in the comp set and the freshness of the data.
Here is the loop every calculator runs, named or not:
- Define a comp set with a location and filters.
- Read each comp’s price and availability.
- Estimate occupancy from the calendars.
- Aggregate to a representative rate (often a median or percentile band).
- Project revenue with the formula below.
That is the whole machine. A polished UI sits on top, but underneath it is these five steps over public listing data.
What’s the formula behind the estimate?
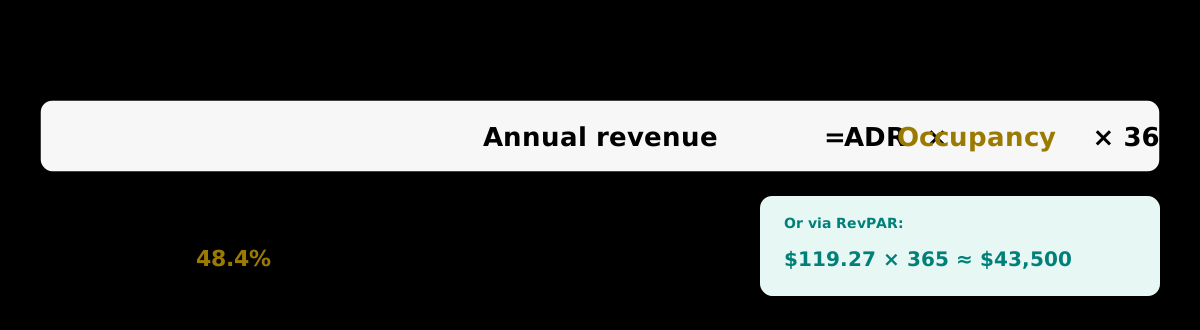
Annual revenue is roughly average daily rate times occupancy times 365. ADR is the typical nightly price across the comp set; occupancy is the share of available nights that get booked. Multiply them by the nights in a year and you have a revenue projection. Using AirDNA’s January 2026 U.S. benchmarks, an ADR of $246.62 at 48.4% occupancy works out to about $43,500 per available rental per year.
The same number falls out of RevPAR, revenue per available rental, which already bakes occupancy into the rate. AirDNA put RevPAR at $119.27, and $119.27 times 365 is the same roughly $43,500.
So the formula is not the hard part. Plenty of people can multiply three numbers. The hard part is getting an ADR and an occupancy figure that actually describe your comp set, today, rather than a stale citywide average.
How accurate are Airbnb revenue calculators?
They are directional estimates, not guarantees. Three things drive the accuracy: how well the comp set matches your listing, how fresh the price and availability data is, and how occupancy gets estimated, since real bookings are private and must be inferred from calendars. Get any one of those wrong and the projection inherits the error.
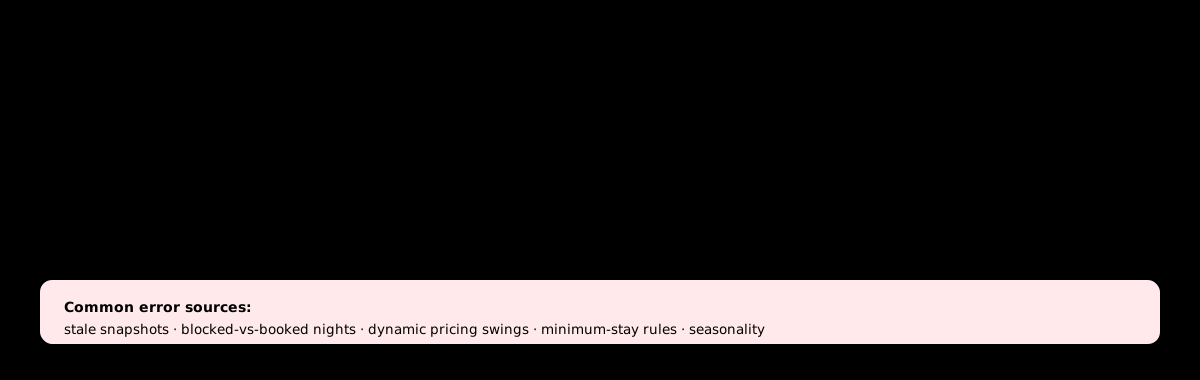
The biggest source of error is usually staleness.
A calculator running on a three-month-old snapshot will hand you a confident annual figure that no longer reflects the market. Prices move with seasonality, supply shifts, and demand swings, so a number that was right in spring can be badly wrong by summer.
Occupancy is the second trap. You can read a calendar, but a blocked night might be booked or might just be the host taking it off the market. Good calculators model that difference; weak ones treat every blocked night as a booking and overstate revenue.
Honest scope: a revenue calculator is a research tool for sizing an opportunity, not a guaranteed pro forma. Treat the output as a range.
Which Airbnb revenue calculator is best?
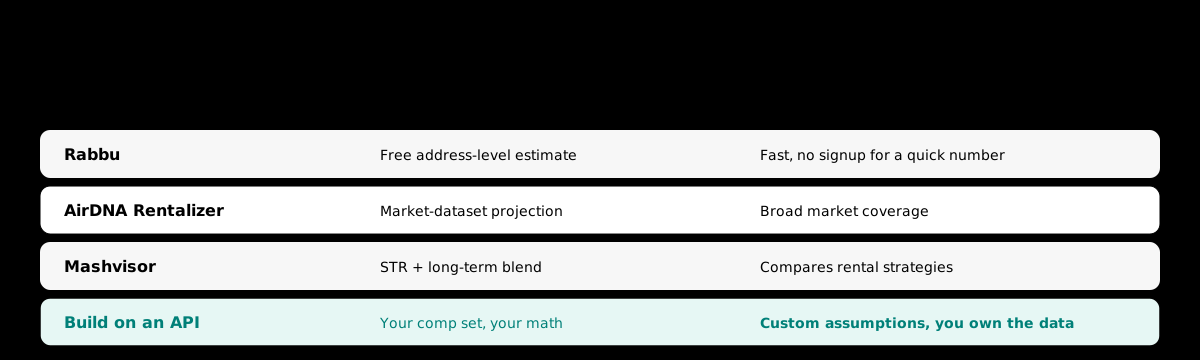
The best-known options are Rabbu, AirDNA’s Rentalizer, and Mashvisor. They mostly differ in comp-set logic, data freshness, and how much they cost. Rabbu offers a free address-level estimate, AirDNA’s Rentalizer leans on its large market dataset, and Mashvisor bundles short-term and long-term analysis. All three are formulas over comp data, so their answers diverge when their comp sets do.
| Tool | Model | Strength |
|---|---|---|
| Rabbu | Free address-level estimate | Fast, no signup for a quick number |
| AirDNA Rentalizer | Market-dataset projection | Broad market coverage |
| Mashvisor | STR + long-term blend | Compares rental strategies |
| Build on an API | Your comp set, your math | Custom assumptions, you own the data |
For a one-off “what could this property make,” any of the three is fine. When you need custom assumptions, a specific comp set, or estimates embedded in your own product, a fixed calculator stops being enough. That is when you build your own.
How do you build your own Airbnb revenue calculator?
You build it the same way the tools do: enumerate a comp set with a search, pull each comp’s price and availability, estimate occupancy from the calendar, and apply the formula. With Staying API, a search page costs 12 credits and each listing lookup is 1 credit, so a comp set of a few dozen listings costs very little to model, and you control every assumption.
The flow in practice:
POST /v1/searchwith the location, bedroom count, and property type to get the comp set.- Pull pricing and availability for each comp, or use
POST /v1/search/with-detailsto do both at once. - Estimate occupancy from each calendar, then take a median ADR and occupancy across the set.
- Multiply:
ADR x occupancy x 365for annual revenue.
Worked example: a comp set with a median ADR of $250 and an estimated 55% occupancy projects to about $50,200 a year, or roughly $4,180 a month. Swap in a p25 and p75 occupancy and you get a low-to-high band instead of a false-precision single number. We covered the wider analytics picture in Airbnb analytics if you want the full stack.

Build the estimate, don’t just trust it
A revenue calculator is only as good as its comp set and its data. The tools are fine for a quick read, but the number is a black box you can’t tune.
If you want to set your own comps, your own occupancy method, and your own band, grab a free API key and pull a comp set yourself. 100 credits are enough to model a small market and see exactly where the revenue number comes from.
Frequently asked questions
- How does an Airbnb revenue calculator work?
- An Airbnb revenue calculator builds a comp set of similar nearby listings, reads each one's nightly price and availability, estimates occupancy from the calendars, then multiplies a representative rate by booked nights to project annual revenue. The math is simple; the accuracy comes from how good the comp set is and how fresh the underlying listing data is.
- How accurate are Airbnb revenue calculators?
- They are directional estimates, not guarantees. Accuracy depends on comp-set quality, data freshness, and the occupancy method, since true bookings are private and must be inferred from calendars. A calculator running on a stale snapshot can be off by a wide margin. Treat the output as a range, not a single number.
- What data do Airbnb revenue calculators use?
- They use public listing data: nightly prices, availability calendars, bedroom and property type, location, and review counts. From those they derive average daily rate and an occupancy estimate, the two inputs to a revenue projection. Tools collect this data by scraping or through a third-party Airbnb API that returns it as normalized JSON.
- How do you estimate Airbnb annual revenue?
- Annual revenue is roughly average daily rate times occupancy times 365. Using AirDNA's January 2026 U.S. benchmarks, an ADR of $246.62 at 48.4% occupancy implies about $43,500 of revenue per available rental per year. For a specific listing, you swap in its comp set's rate and an occupancy estimate from its calendar.
- Can I build my own Airbnb revenue calculator?
- Yes. With an Airbnb API you enumerate a comp set with a search query, pull each comp's pricing and availability, estimate occupancy from the calendar, and apply the revenue formula. Staying API charges 1 credit per listing lookup and 12 per search page, with 100 free credits, so a small comp set costs very little to model.
- Which Airbnb revenue calculator is best?
- Rabbu, AirDNA's Rentalizer, and Mashvisor are the best-known free and paid options, and they differ mostly in comp-set logic and data freshness. If you need custom assumptions or want to embed estimates in your own product, building on a live Airbnb API beats any fixed calculator because you control the comp set and the math.
Build it on real Airbnb data
Pull listings, photos, host info, reviews, availability, and pricing from one REST endpoint. 100 free credits, no credit card.